First step is to get
jvisualvm installed. If you've got a recent JDK then it's already available in the bin directory of the JDK install. If not, then upgrade to the latest JDK here. Once installed, fire it up and you should see the following.
The left hand side shows the applications you can connect to. You should see a VisualVM instance that allows you to monitor the VisualVM itself. Very meta. The local applications will include all locally running Java applications. Since Clojure itself is a Java application we can fire up a REPL and use that to profile code.
Firstly we'll look at garbage collection by using the memory profiler. People often associate immutable data structures (such as Clojure's) with poor performance since every time we modifying a data structure we are actually creating a completely new structure (in reality that's not quite true, structure that is unchanged is often shared). Using JVisualVM we can profile how fast the JVM can allocate objects. Let's use a really simple example which sums up the numbers 1 to 100K. Without JVirtualVM this takes 40ms. In those 40 seconds we create at least 100K objects.
  user> (time (reduce + (range 100000))
  "Elapsed time: 40.677795 msecs"
  4999950000
If we instrument this we can see that 165K
java.lang.Integer objects are created together with 35K java.lang.Long objects. In this example then we're creating roughly 4 million objects per second! Pretty impressive (I realize this is totally non scientific, I'm just aiming to get a feel for the numbers!).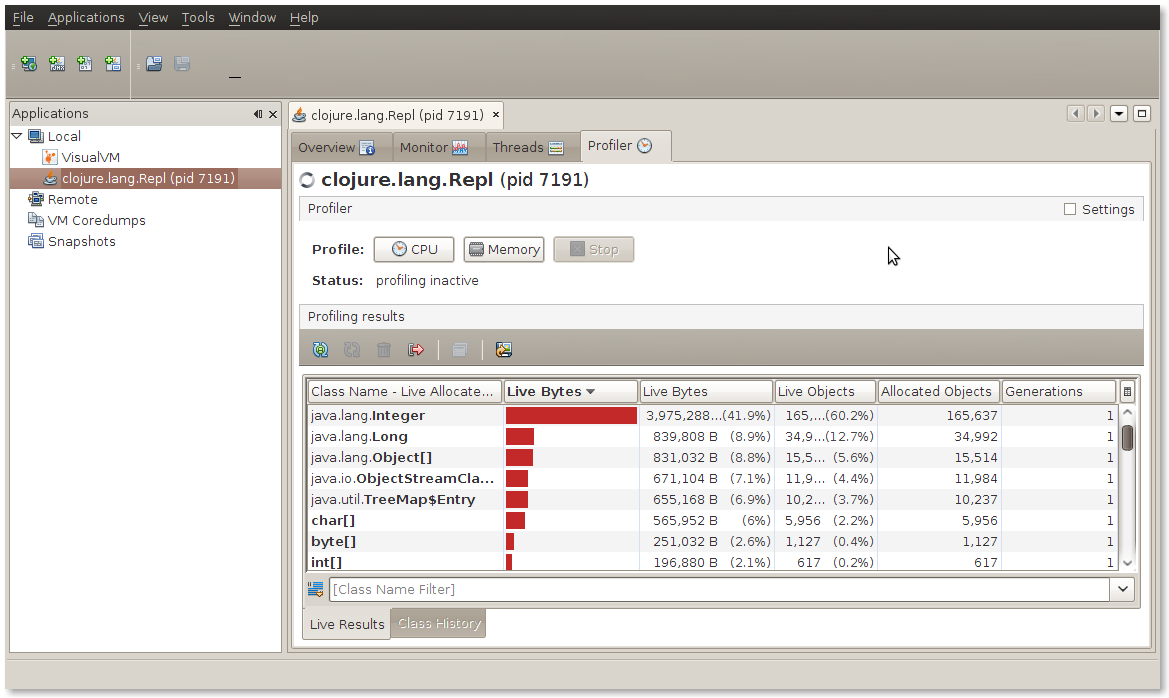
Another area in which you can apply JVisualVM is looking for optimizations and monitoring threads. In one of my previous posts, I looked at Mandlebrot fractal generation. We can use jvisualvm to understand the performance characteristics of the application. The only interesting part of the code for this experiment is shown below:
(defn calculate-pixels []
  (let [pixels (range 0 (* *width* *height*))]
    (pmap (fn [p]
            (let [row (rem p *width*) col (int (/ p *height*))]
              (get-color (process-pixel (/ row (double *width*)) (/ col (double *height*))))))
          pixels)))
Running this with a single-threaded
map instead of pmap gives us the following CPU information.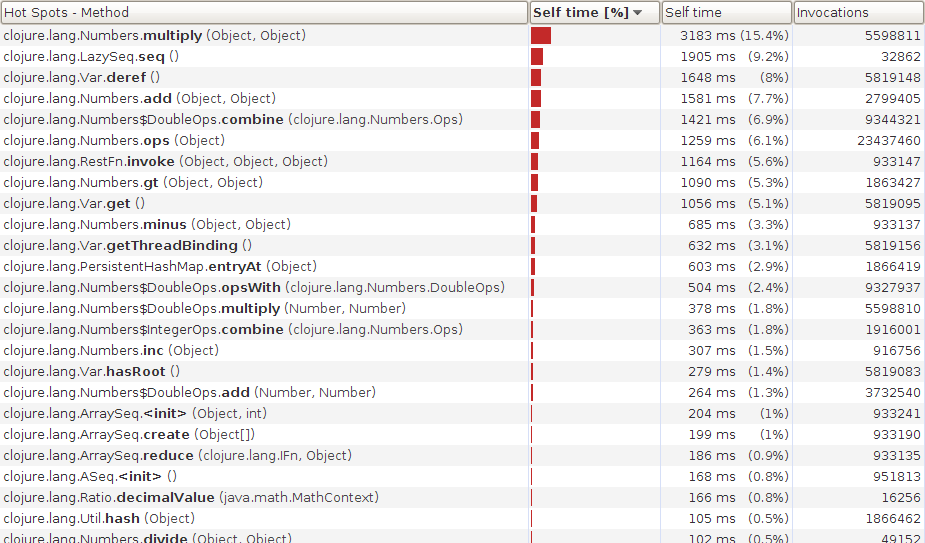
The time is dominated by mathematical operations. This is what you'd expect. You'd expect (naively) if you used multiple threads you'd be able to speed things up since the operations on each pixel are independent. What happens if we switch to
pmap?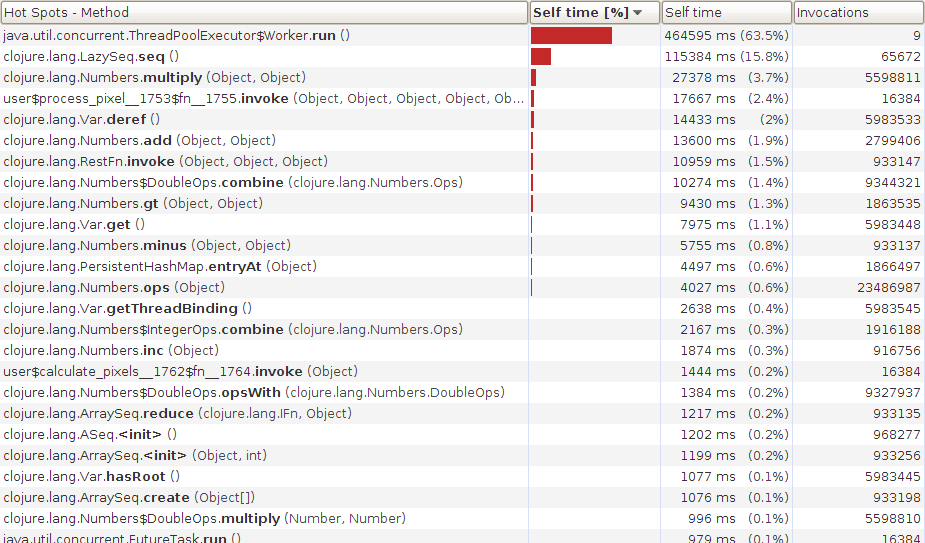
There's a big change. The time now is dominated by
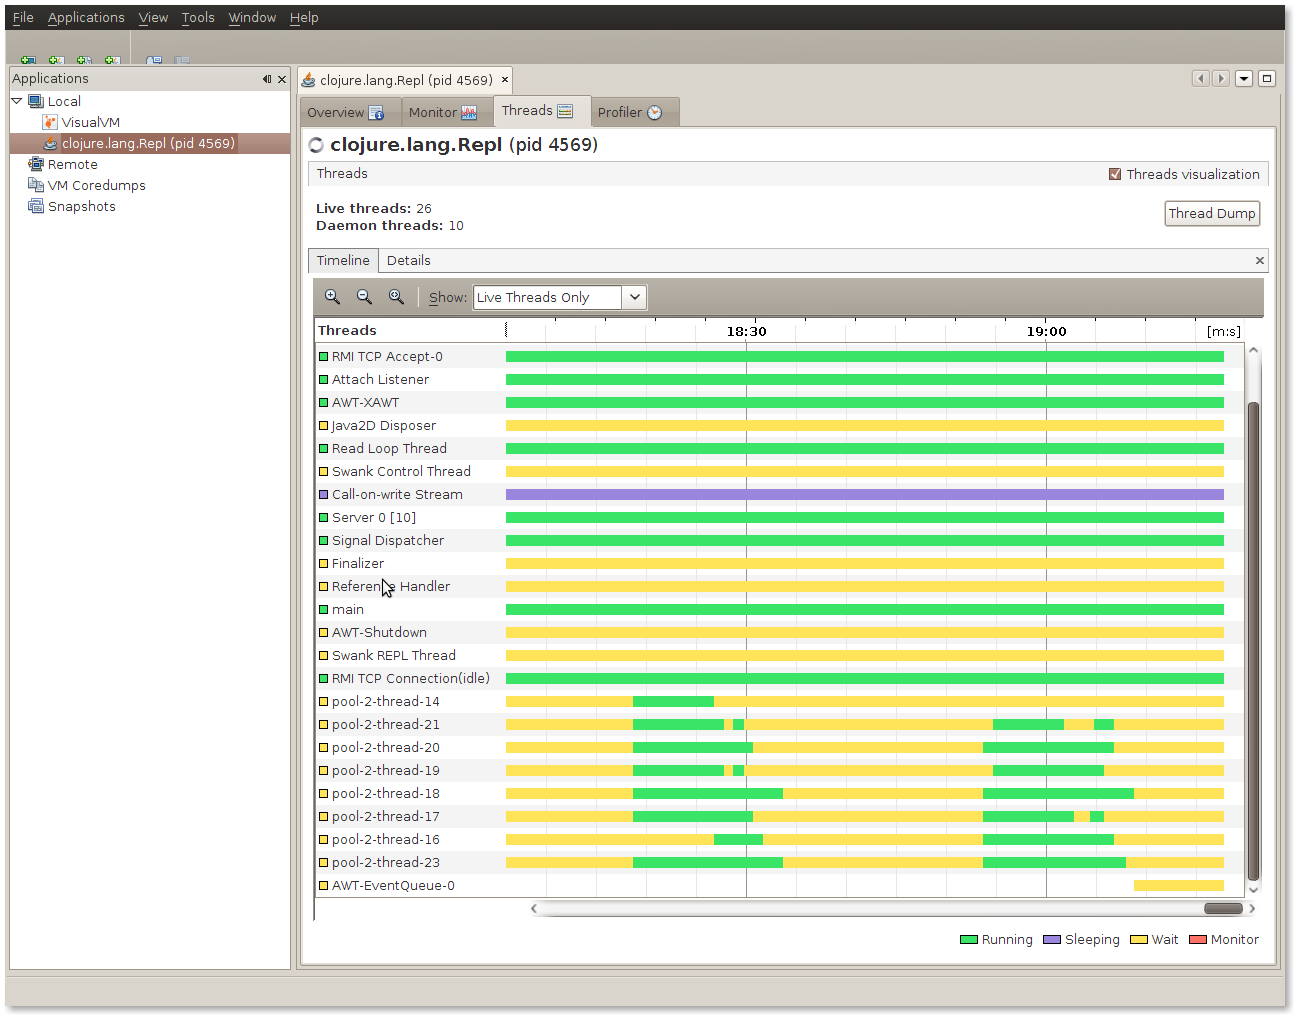
ThreadPoolExecutor$Worker which is taking up a huge percentage of the time. My guess is that we're context switching far too much - using jvisualvm we can get a view of what the threads were doing: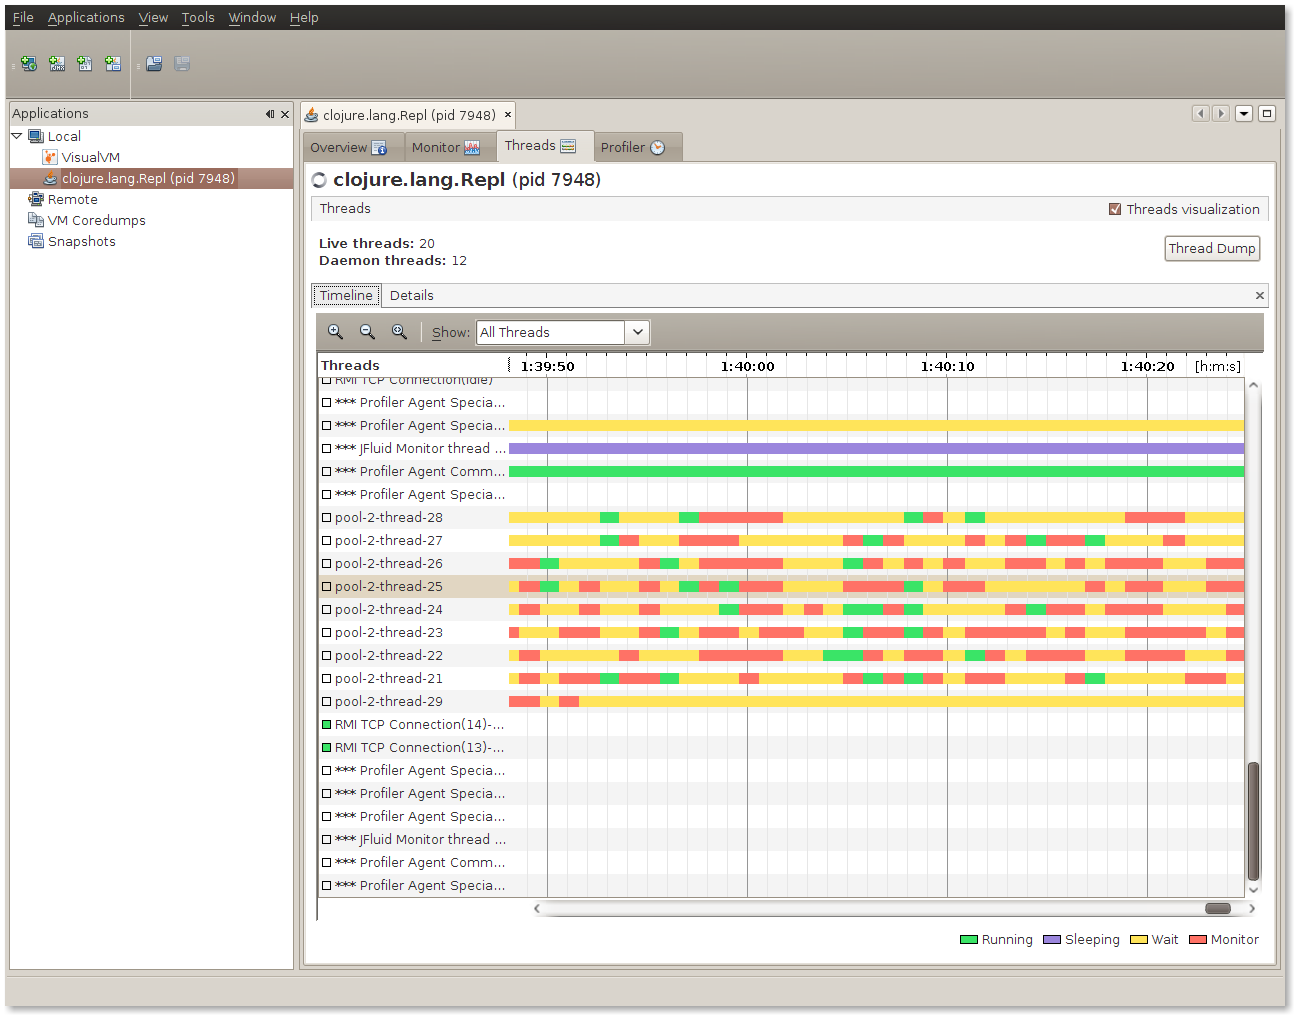
The image shows that the threads spent a lot of time waiting and not a lot of time doing processing. Opportunities for simultaneous processing were few because of the time spent spawning off tiny amounts of work.
Let's partition off chunkier bits of works in an effort to make the CPU work harder for its money. In the function below I use
partition to break the set of pixels to render into 16 discrete chunks (number chosen at random). We use pmap again but this time it's got chunker bits of work to do. doall is used to force the evaluation of the inner map.
(defn calculate-pixels-2 []
  (let [n (* *width* *height*)
        work (partition (/ n 16) (range 0 n))
        result (pmap (fn [x]
                   (doall (map
                    (fn [p]
                      (let [row (rem p *width*) col (int (/ p *height*))]
                        (get-color (process-pixel (/ row (double *width*)) (/ col (double *height*))))))
                    x)))
                   work)]
    (doall (apply concat result))))
The difference this makes is very visible. The graphic below shows two runs. Each time we can see that the threads are fully busy, not blocked and able to fully utilize the CPU. The worker threads are indicated at the bottom in the image below.
So using VisualVM helped quantify various improvements. Whilst premature optimization is the root of all evil, if you are going to optimize then it should be guided by a tool rather than your intuition (which if you are anything like me is more often than not crap).
The images aren't showing up for me...
ReplyDeleteHi,
ReplyDeleteSorry for the problems!
My domain's CNAME record is currently changing over at the moment, so I suspect this is behind the not being able to see the images) as it'll take a few hours for this to filter through to the relevant places.
I'll take a look tomorrow and if it's still broken I'll update the links. It looks like a redirect from www.fatvat.co.uk -> fatvat.co.uk isn't in place yet. If you want, you should be able to see the images using the fatvat.co.uk prefix (minus the www).
great post. fyi clojure.lang.Repl (and Script) has been supersceded by clojure.main
ReplyDeletejava clojure.main --help
@Kevin - Thanks - I haven't looked at Clojure at all over the last few months. Will definitely be interesting to see what's evolved over the last few months.
ReplyDeleteThanks! Didn't even know about this tool. Your tutorial sure helps too.
ReplyDelete